
The dashboard and the logs
Three parts of the window answer the question "what has been going on?" — the dashboard gives you the shape of it, and two separate logs give you the detail.
The dashboard
Choose DASHBOARD along the bottom of the window.
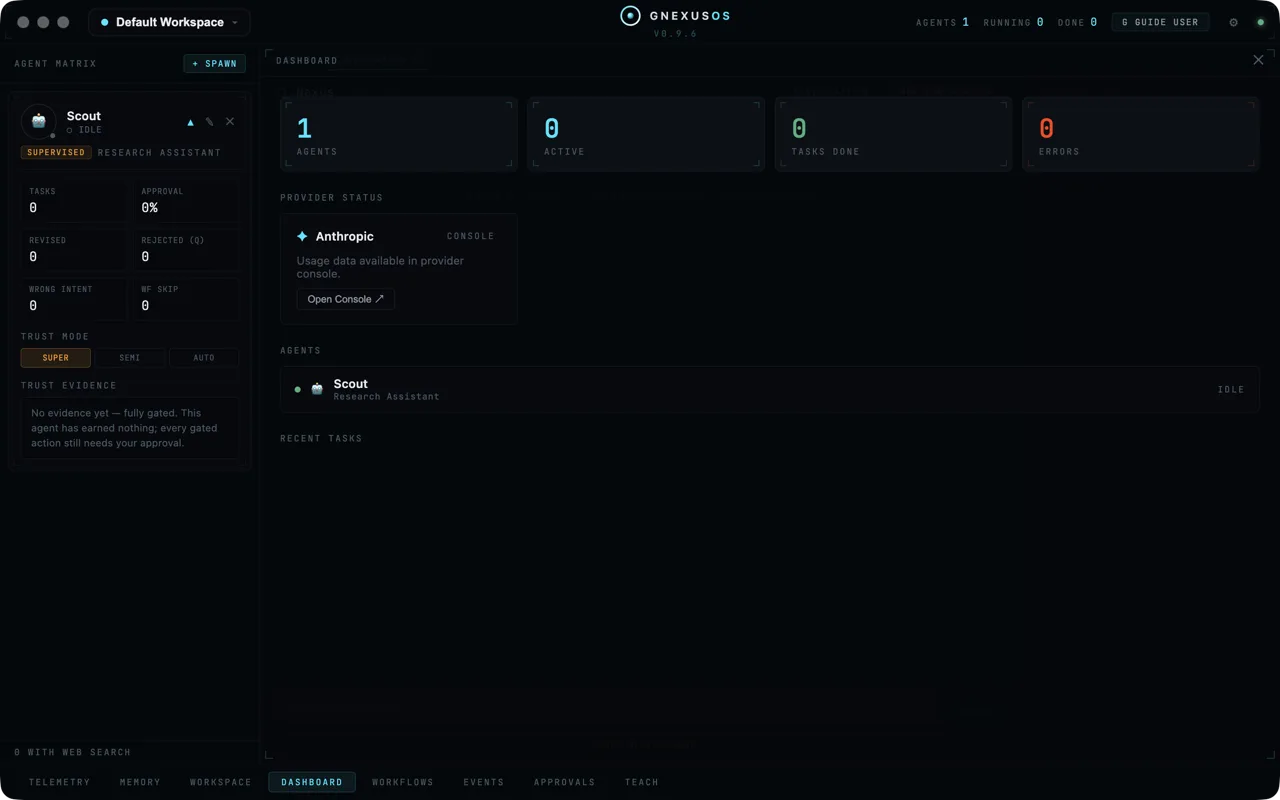
The four counters
| Counter | What it counts |
|---|---|
| AGENTS | How many agents exist in this workspace |
| ACTIVE | How many are working right now |
| TASKS DONE | How many tasks have finished |
| ERRORS | How many have failed |
The one to watch is ERRORS. It is shown in red for a reason. A handful of errors over a busy week is normal. Errors climbing while TASKS DONE stays flat means something is broken — a provider key that has stopped working, a model that no longer exists, or a job no agent can actually do. Open TELEMETRY and filter by ERROR to see which.
Provider status
Underneath is a card for each AI service you have connected. The card carries a CONSOLE badge and says:
Usage data available in provider console.
with an Open Console ↗ button.
This is deliberate, and worth understanding. GNexusOS does not meter your spending. You buy capacity directly from the provider, your key is yours, and the only authoritative record of what you have spent is the provider's own dashboard. The app does not try to guess, because a guess that is wrong about money is worse than no number at all. The button takes you to the real figure.
Agents and recent tasks
Below that, every agent is listed with a status dot and its current state — IDLE when it has nothing to do — and then the most recent tasks.
This is the fastest way to answer "is anything running?" without opening anything else.
Events
Choose EVENTS along the bottom of the window.
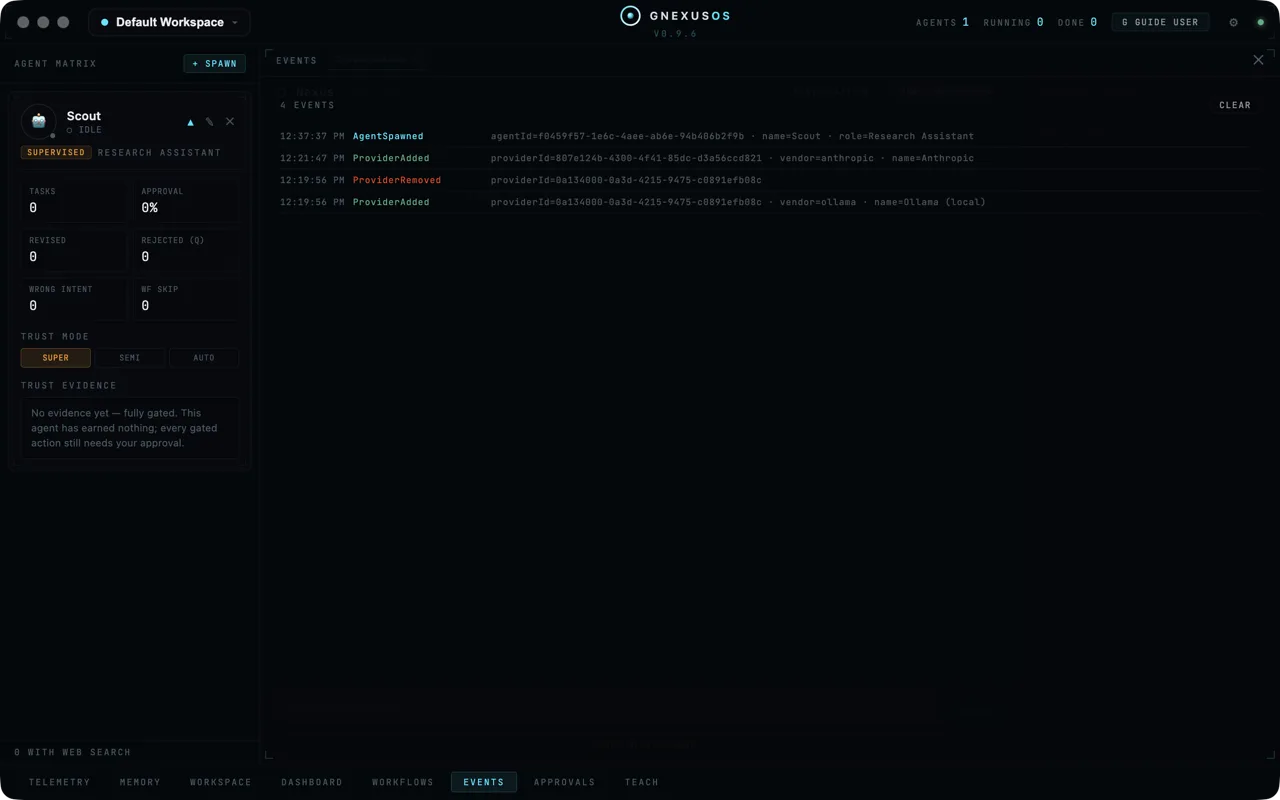
This is the running record of things that happened in the app: an agent created, a provider added or removed, and so on. Each line has three parts — the time, the kind of event, and the details.
Event names are colour-coded so you can scan rather than read. Removals and failures stand out from ordinary activity.
CLEAR at the top right empties the list. It affects only this view, not the activity log described below.
Events are most useful for the "hang on, what just changed?" moment. If an agent starts behaving differently, this is the first place to look.
The activity log
Open System Config (the gear at the top right) and choose Activity.
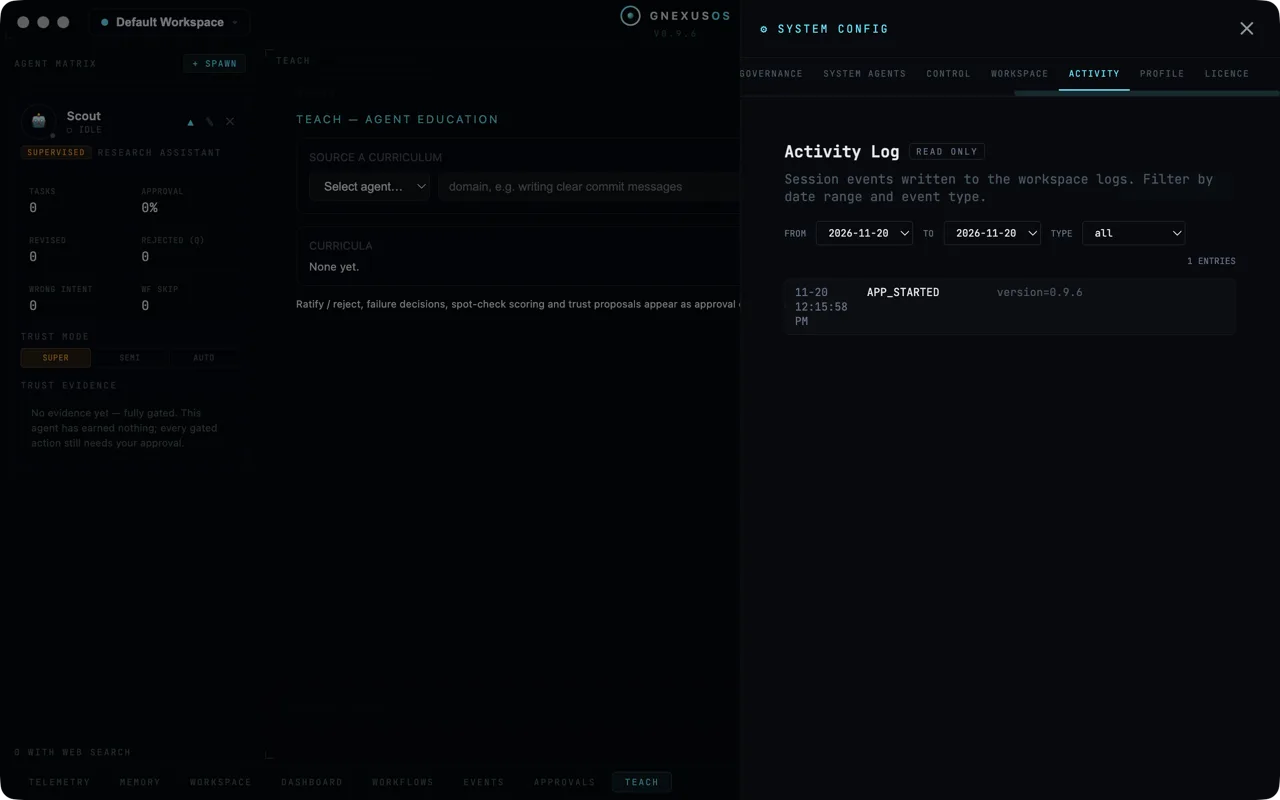
The panel describes itself:
Session events written to the workspace logs. Filter by date range and event type.
It is marked READ ONLY, and that is the difference between the two logs. Events in the panel above are a live feed you can clear. The activity log is written to files in your workspace and cannot be edited from inside the app. It is the record you would hand to someone asking what happened and when.
Each entry carries a date, a time, an event type and its details — for example
APP_STARTED version=0.9.6.
Use the FROM and TO dates to narrow it to a day, and TYPE to narrow it to one kind of event.
Which one do I want?
| Question | Where to look |
|---|---|
| Is anything running right now? | Dashboard |
| Are tasks failing? | Dashboard, then TELEMETRY filtered to ERROR |
| What did this one task actually do? | TELEMETRY, click the task |
| What changed in the app recently? | Events |
| What happened on a specific day? | Activity log |
| What have I spent? | Your provider's own console |